Question 11:
Use a graph paper to answer this question.
Table 2 shows the values of two variables, x and y, obtained from an experiment. The variables x and y are related by the equation where a and b are constants.
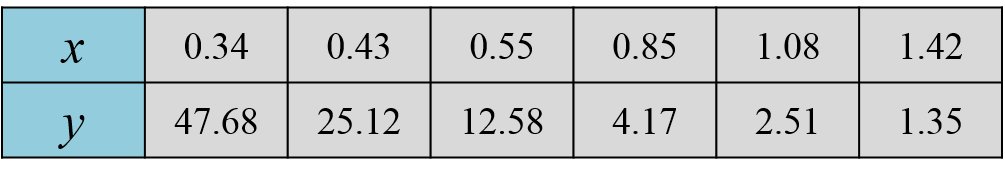 Table 2
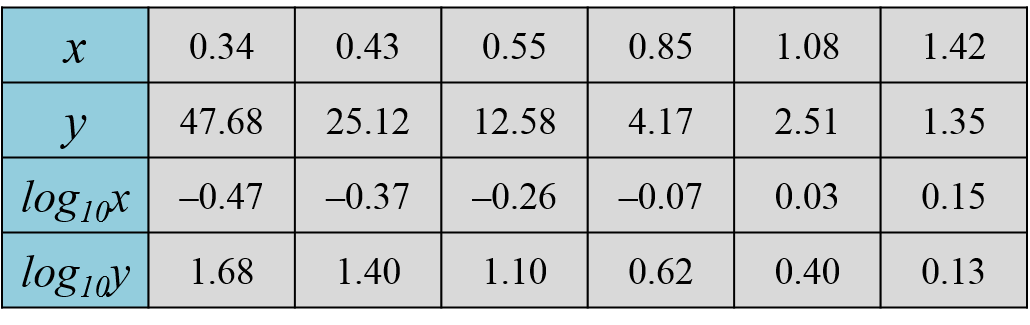
(a) Based on Table 2, construct a table for the values of log10x and log10y. [2 marks]
(b) Plot log10y against log10x, using a scale of 2 cm to 0.1 unit on the X-axis and 2 cm to 0.2 unit on the Y-axis.
Hence, draw the line of best fit. [3 marks]
(c) Using the graph in 11(b), find the value of [5 marks]
(i) a,
(ii) b.
Solution:
(a)
(b)
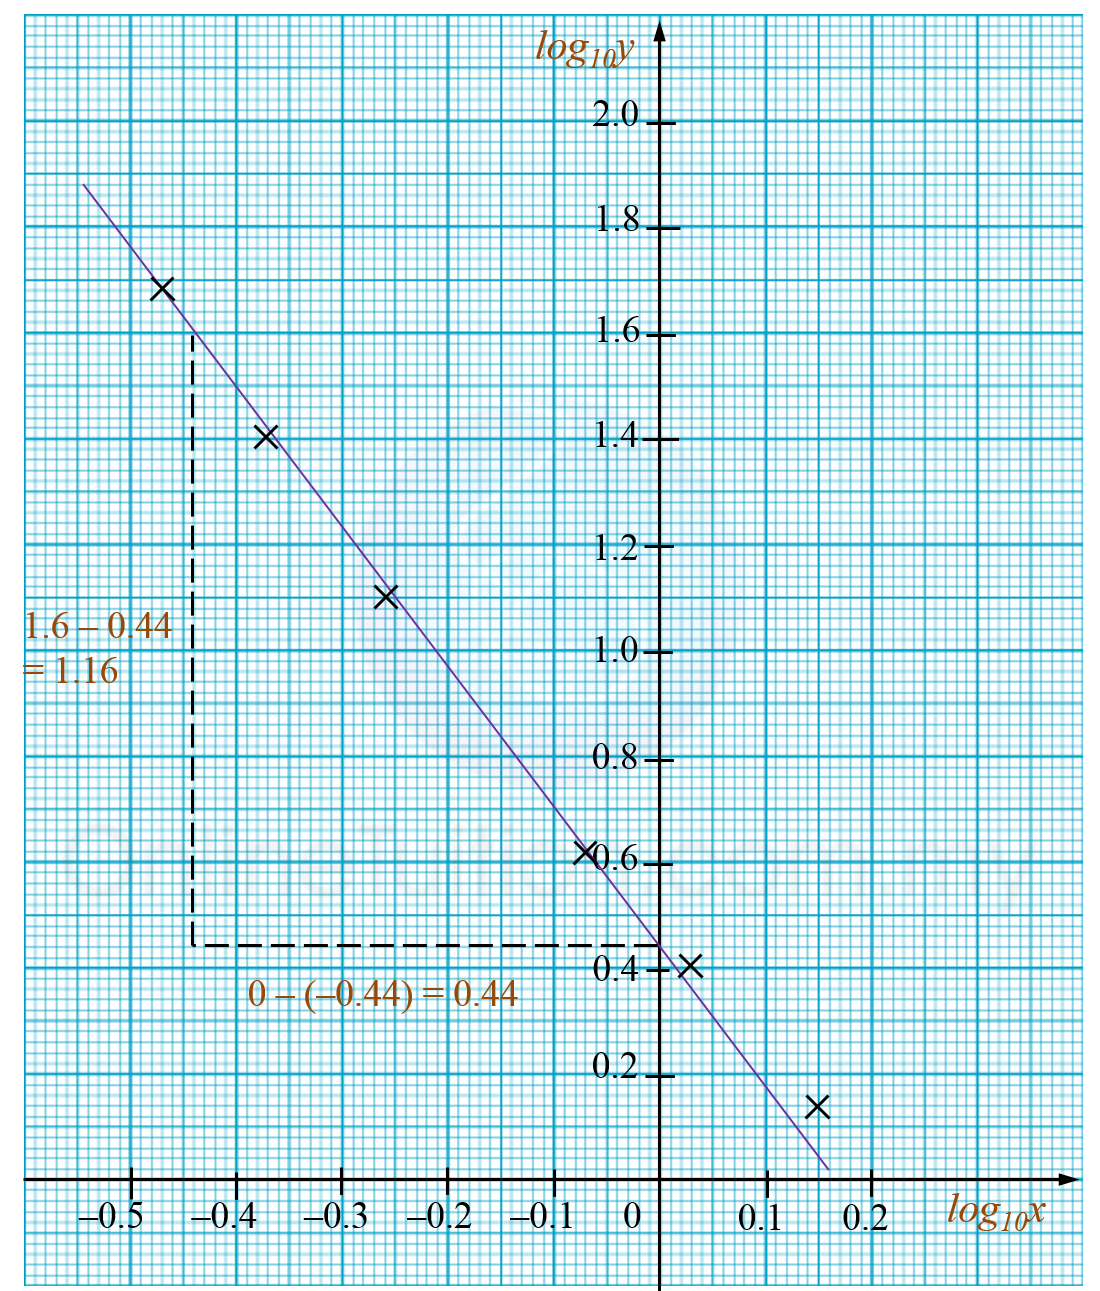
(c)
(c)(i)
(c)(ii)
Use a graph paper to answer this question.
Table 2 shows the values of two variables, x and y, obtained from an experiment. The variables x and y are related by the equation where a and b are constants.
Table 2(a) Based on Table 2, construct a table for the values of log10x and log10y. [2 marks]
(b) Plot log10y against log10x, using a scale of 2 cm to 0.1 unit on the X-axis and 2 cm to 0.2 unit on the Y-axis.
Hence, draw the line of best fit. [3 marks]
(c) Using the graph in 11(b), find the value of [5 marks]
(i) a,
(ii) b.
Solution:
(a)
(c)(i)
(c)(ii)