Question 4:
Diagram 2 shows the curve y = 4x – x2 and tangent to the curve at point Q passes point P.
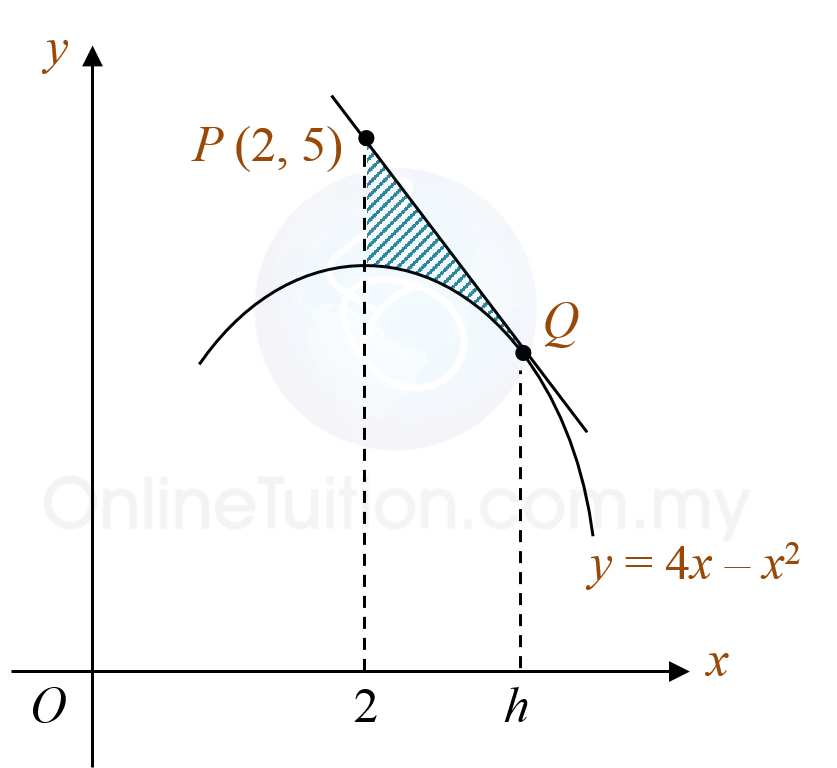 Diagram 2
(a) Show that h = 3. [4 marks]
(b) Calculate the area of the shaded region. [4 marks]
Solution:
(a)
(b)
Diagram 2 shows the curve y = 4x – x2 and tangent to the curve at point Q passes point P.
Diagram 2(a) Show that h = 3. [4 marks]
(b) Calculate the area of the shaded region. [4 marks]
Solution:
(a)
(b)