Question 10 (10 marks):
Diagram 7 shows the straight line 4y = x – 2 touches the curve x = y2 + 6 at point P.
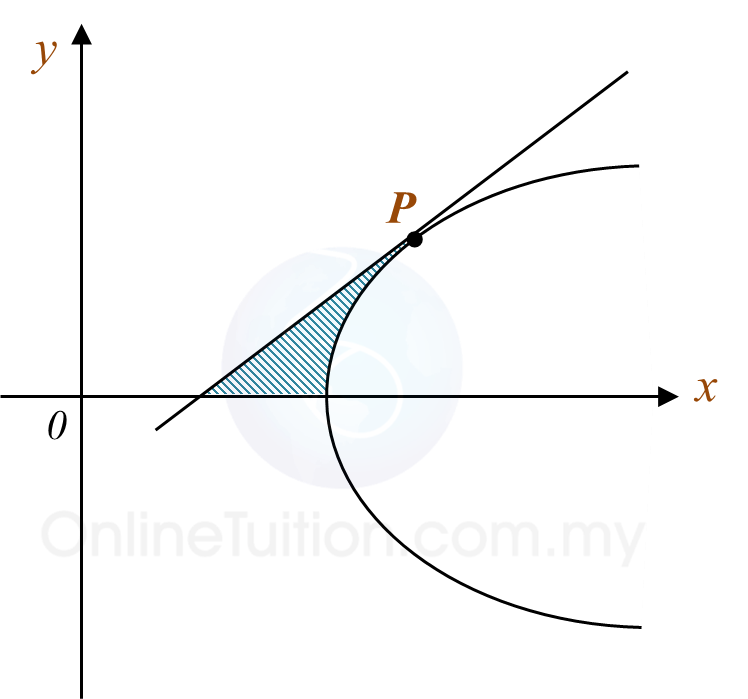
Find
(a) the coordinates of P,
(b) the area of the shaded region,
(c) the volume of revolution, in terms of π, when the region bounded by the curve and the straight line x = 8 is revolved through 180o about the x-axis.
Solution:
(a)
(b)
(c)
Diagram 7 shows the straight line 4y = x – 2 touches the curve x = y2 + 6 at point P.
Find
(a) the coordinates of P,
(b) the area of the shaded region,
(c) the volume of revolution, in terms of π, when the region bounded by the curve and the straight line x = 8 is revolved through 180o about the x-axis.
Solution:
(a)
(b)
(c)
Question 11 (10 marks):
Use a graph to answer this question.
Table 1 shows the values of two variables, x and y, obtained from an experiment. A straight line will be obtained when a graph of is plotted.

(a) Based on Table 1, construct a table for the values of
(c) Using the graph in 11(b)
(i) find the value of y when x = 2.7,
(ii) express y in terms of x.
Solution:
(a)

(b)

(c)(i)
(c)(ii)
Use a graph to answer this question.
Table 1 shows the values of two variables, x and y, obtained from an experiment. A straight line will be obtained when a graph of is plotted.
(a) Based on Table 1, construct a table for the values of
(c) Using the graph in 11(b)
(i) find the value of y when x = 2.7,
(ii) express y in terms of x.
Solution:
(a)
(b)
(c)(i)
(c)(ii)