Question 5:
Use graph paper to answer this question.
Table 1 shows the values of two variables, x and y, obtained from an experiment. The variables x and y are related by the equation y = hkx + 1, where h and k are constants.
x |
1 |
2 |
3 |
4 |
5 |
6 |
y |
4.0 |
5.7 |
8.7 |
13.2 |
20.0 |
28.8 |
Table 1
(a) Based on table 1, construct a table for the values (x + 1) and log y. [2 marks]
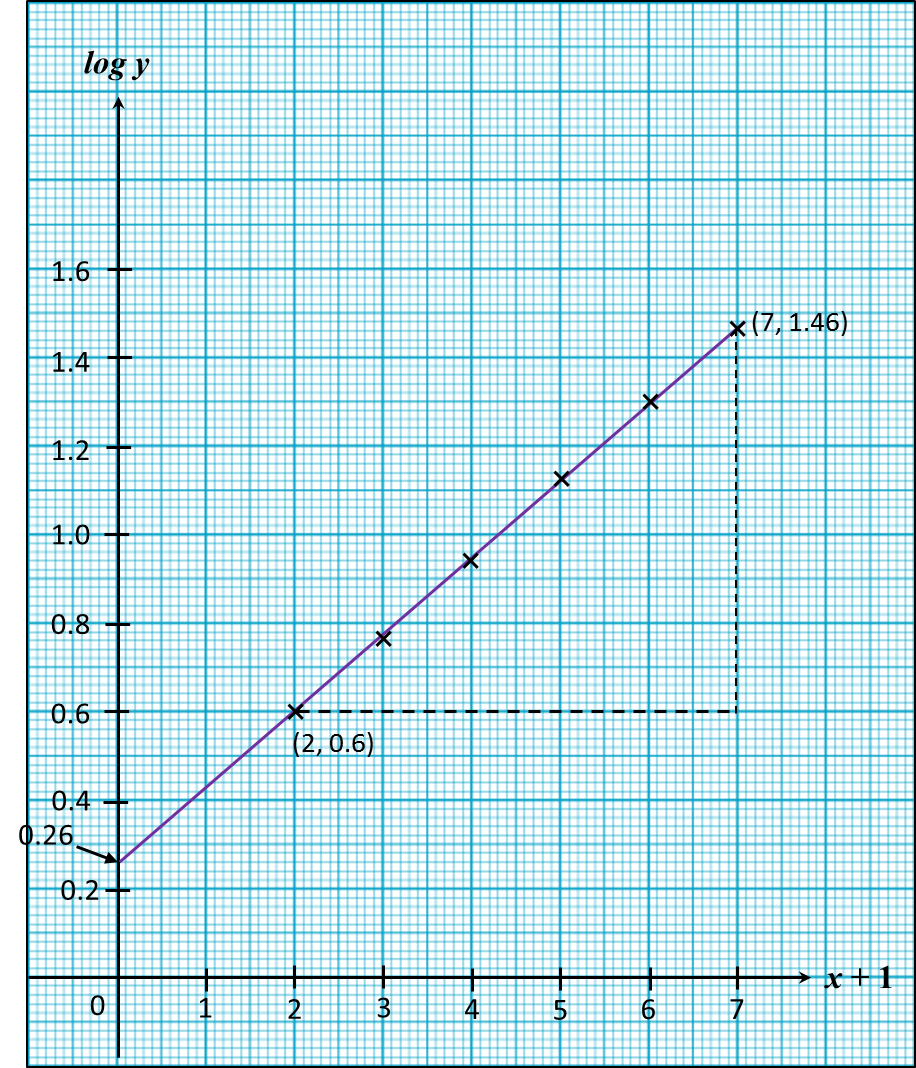
(b) Plot log y against (x + 1), using a scale of 2 cm to 1 uint on the (x + 1) –axis and 2 cm to 0.2 unit on the log y-axis.
Hence, draw the line of best fit. [3 marks]
(c) Use your graph in 9(b) to find the value of
(i) h.
(ii) k. [5 marks]
(i) h.
(ii) k. [5 marks]
Solution:
(a)
x + 1 |
2 |
3 |
4 |
5 |
6 |
7 |
log y |
0.60 |
0.76 |
0.94 |
1.12 |
1.30 |
1.46 |
(b)
(c)
y = hkx + 1
log y = log h + (x + 1) log k
log y = log k (x + 1) + log h
Y = log y
m = log k
X = (x + 1)
c = log h
m = log k
X = (x + 1)
c = log h
(i)
log h = y-intercept
log h = 0.26
h = 1.82
(ii)
perkongsian bijak, m
berguna untuk saya