Question 23 (4 marks):
A set of data consists of 2, 3, 4, 5 and 6. Each number in the set is multiplied by m and added by n, where m and n are integers. It is given that the new mean is 17 and the new standard deviation is 4.242.
Find the value of m and of n.
Solution:
A set of data consists of 2, 3, 4, 5 and 6. Each number in the set is multiplied by m and added by n, where m and n are integers. It is given that the new mean is 17 and the new standard deviation is 4.242.
Find the value of m and of n.
Solution:
Question 24 (3 marks):
Diagram 9 shows the graph of binomial distribution X ~ B(3, p).
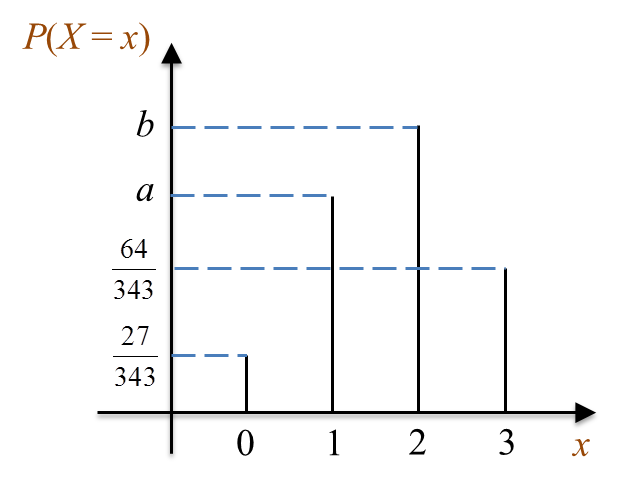 Diagram 9
(a) Express P(X = 0) + P(X > 2) in terms of a and b.
(b) Find the value of p.
Solution:
(a)
P(X = 0) + P(X = 1) + P(X = 2) + P(X = 3) = 1
P(X = 0) + a + b + P(X = 3) = 1
P(X = 0) + P(X = 3) = 1 – a – b
P(X = 0) + P(X > 2) = 1 – a – b
(b)
Diagram 9 shows the graph of binomial distribution X ~ B(3, p).
Diagram 9(a) Express P(X = 0) + P(X > 2) in terms of a and b.
(b) Find the value of p.
Solution:
(a)
P(X = 0) + P(X = 1) + P(X = 2) + P(X = 3) = 1
P(X = 0) + a + b + P(X = 3) = 1
P(X = 0) + P(X = 3) = 1 – a – b
P(X = 0) + P(X > 2) = 1 – a – b
(b)
Question 25 (4 marks):
Diagram 10 shows a standard normal distribution graph.
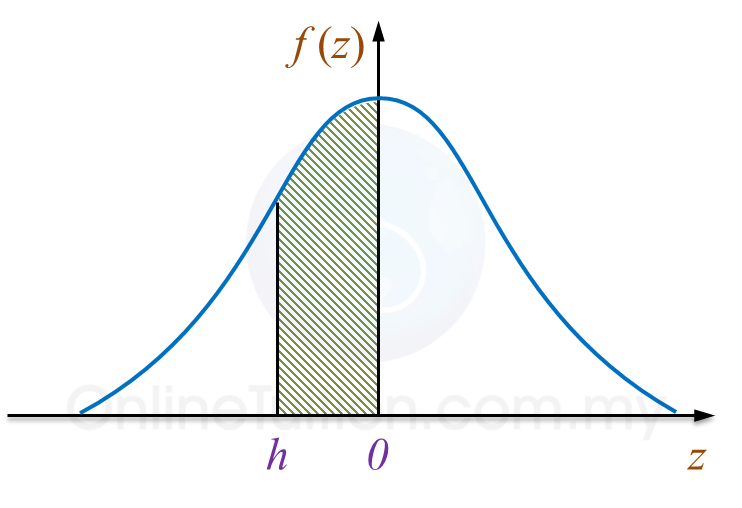 Diagram 10
The probability represented by the area of the shaded region is 0.2881.
(a) Find the value of h.
(b) X is a continuous random variable which is normally distributed with a mean, μ and a variance of 16.
Find the value of μ if the z-score of X = 58.8 is h.
Solution:
(a)
P(X < h) = 0.5 – 0.2881
P(X < h) = 0.2119
P(X < –0.8) = 0.2119
h = –0.8
(b)
Diagram 10 shows a standard normal distribution graph.
Diagram 10The probability represented by the area of the shaded region is 0.2881.
(a) Find the value of h.
(b) X is a continuous random variable which is normally distributed with a mean, μ and a variance of 16.
Find the value of μ if the z-score of X = 58.8 is h.
Solution:
(a)
P(X < h) = 0.5 – 0.2881
P(X < h) = 0.2119
P(X < –0.8) = 0.2119
h = –0.8
(b)