5.2b Standard Normal Distribution Tables (Example 1)
Example 1:
Find the value of each of the following probabilities by reading the standard normal distribution tables.
(a) P (Z > 0.600)
(b) P (Z < –1.24)(c) P (Z > –1.1)
(d) P (Z < 0.76)
Solution:
Standard Normal Distribution Table
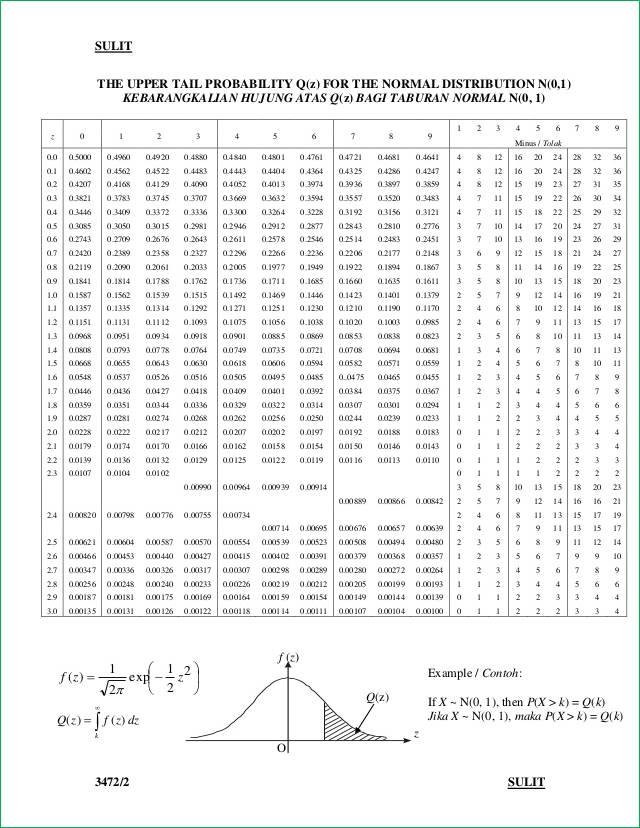
*When reading the standard normal distribution tables, it involves subtraction of values.
*When reading the standard normal distribution tables, it involves subtraction of values.
(a)
From the standard normal distribution table, P (Z > 0.600) = 0.2743

(b)
P (Z < –1.24)
= P (Z > 1.24)
= Q (1.24)
= 0.1075 ← (reading from the standard normal distribution table)
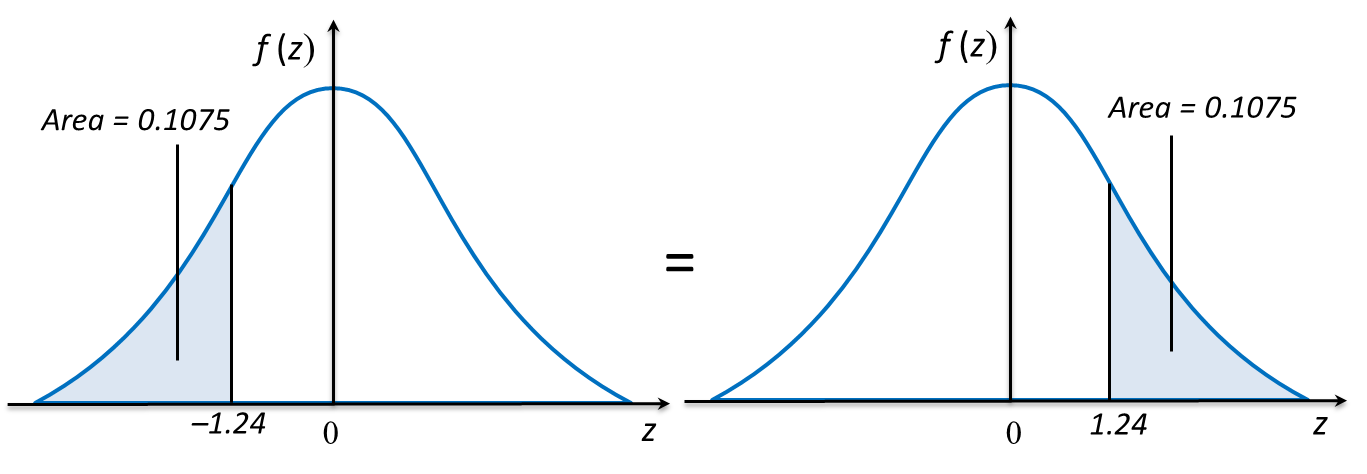
(*In the standard normal distribution table, all the values of z are positive. As the curve is symmetrical about the vertical axis, the area of the shaded region in both of the graphs are the same.)
(c)
(d)
(c)
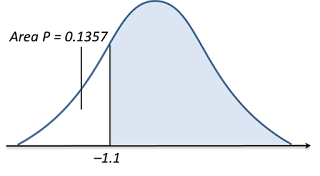
P (Z > –1.1)
= 1 – Area P
= 1 – Q (–1.1)
= 1 – 0.1357 ← (reading from the standard normal distribution table)
= 0.8643

(d)
P (Z < 0.76)
= 1 – Area P
= 1 – Q (0.76)
= 1 – 0.2236 ← (reading from the standard normal distribution table)
= 0.7764
