If you are asked to sketch the graph of a quadratic function, you need to show
a. the shape of the graph
b. the maximum/minimum point of the graph
c. the x-intercept of the graph
d. the y-intercept of the graph
Example
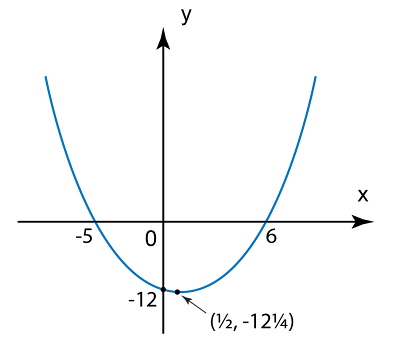
Sketch the curve of the quadratic function
Answer:
The shape of the graph
Since the coefficient of x2 is positive, hence the graph is a U shape parabola with a minimum point.
The minimum point of the graph
By completing the square
For y-intercept, x = 0
For x-intercept, f(x) = 0
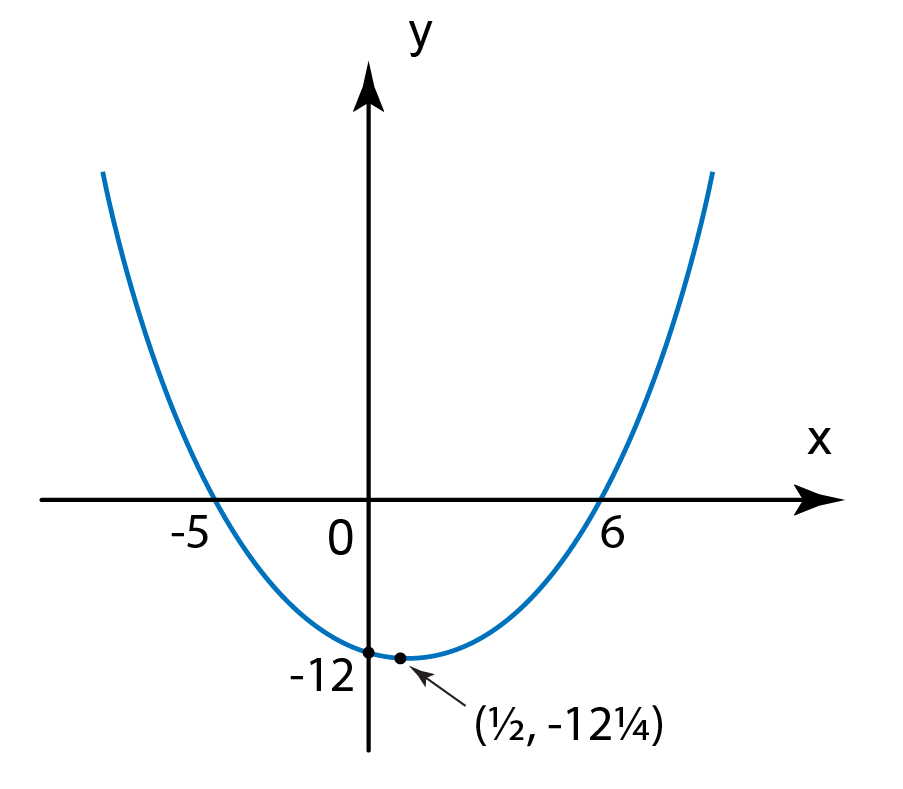
Sketch the curve of the quadratic function
Answer:
The shape of the graph
Since the coefficient of x2 is positive, hence the graph is a U shape parabola with a minimum point.
The minimum point of the graph
By completing the square
For y-intercept, x = 0
For x-intercept, f(x) = 0
Suggested Video