Question 3
The table below shows the values of two variables, x and y, obtained from an experiment. The variables x and y are related by the equation , where k and p are constants.

(a) Based on the table above, construct a table for the values of and . Plot against , using a scale of 2 cm to 0.1 unit on the – axis and 2 cm to 0.2 unit on the – axis. Hence, draw the line of best fit.
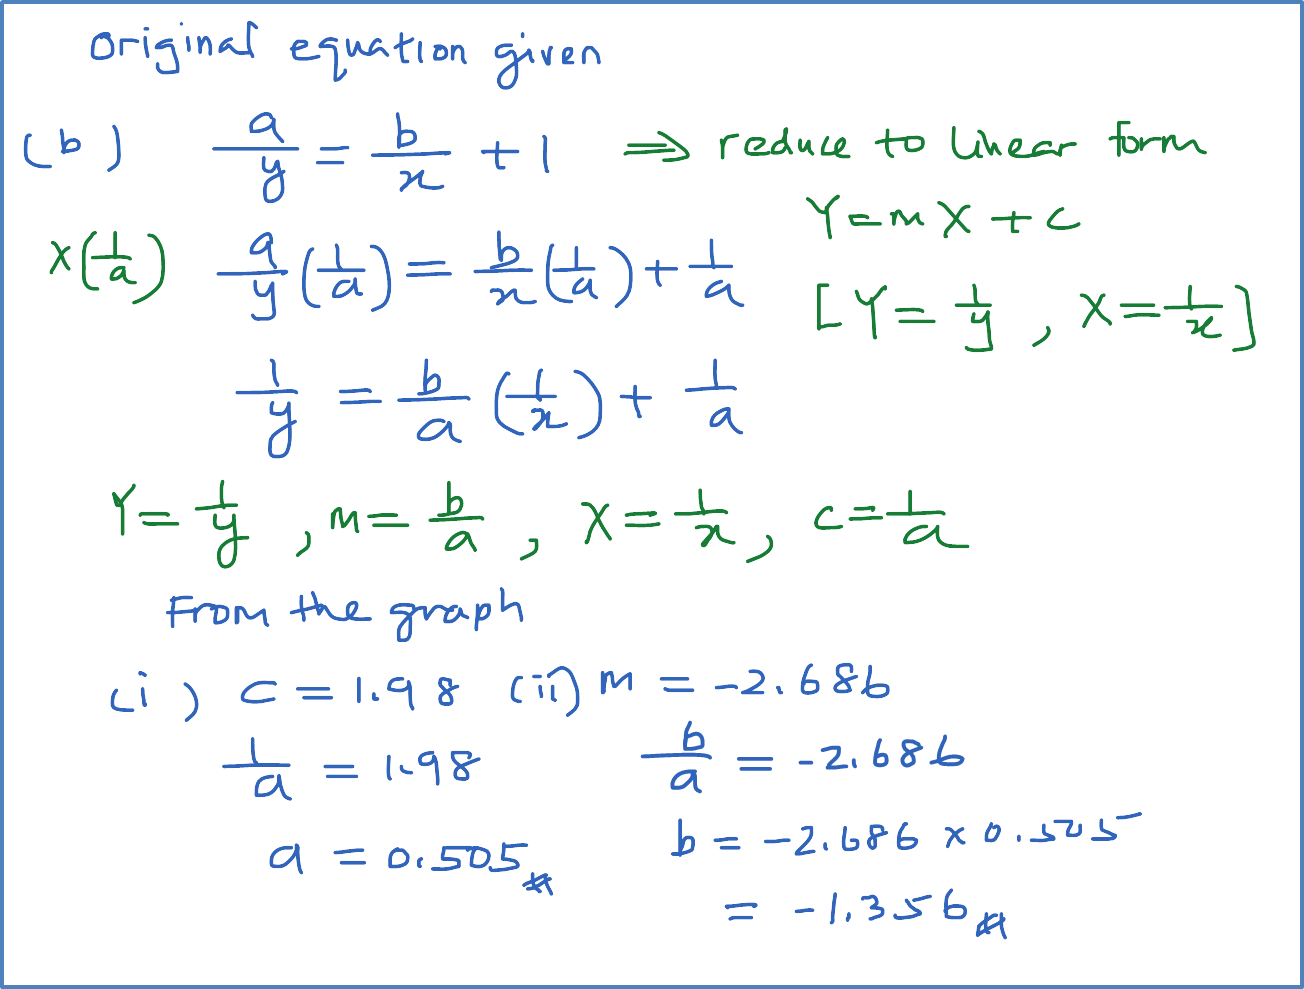
(b) Use the graph from (b) to find the value of
(i) a,
(ii) b.
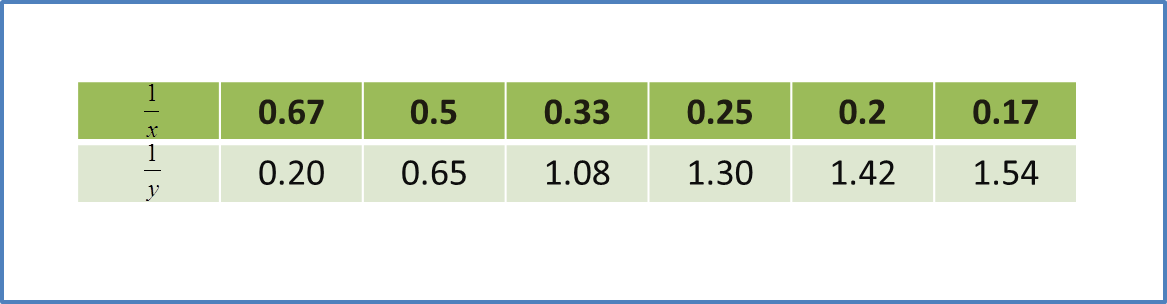
The table below shows the values of two variables, x and y, obtained from an experiment. The variables x and y are related by the equation , where k and p are constants.
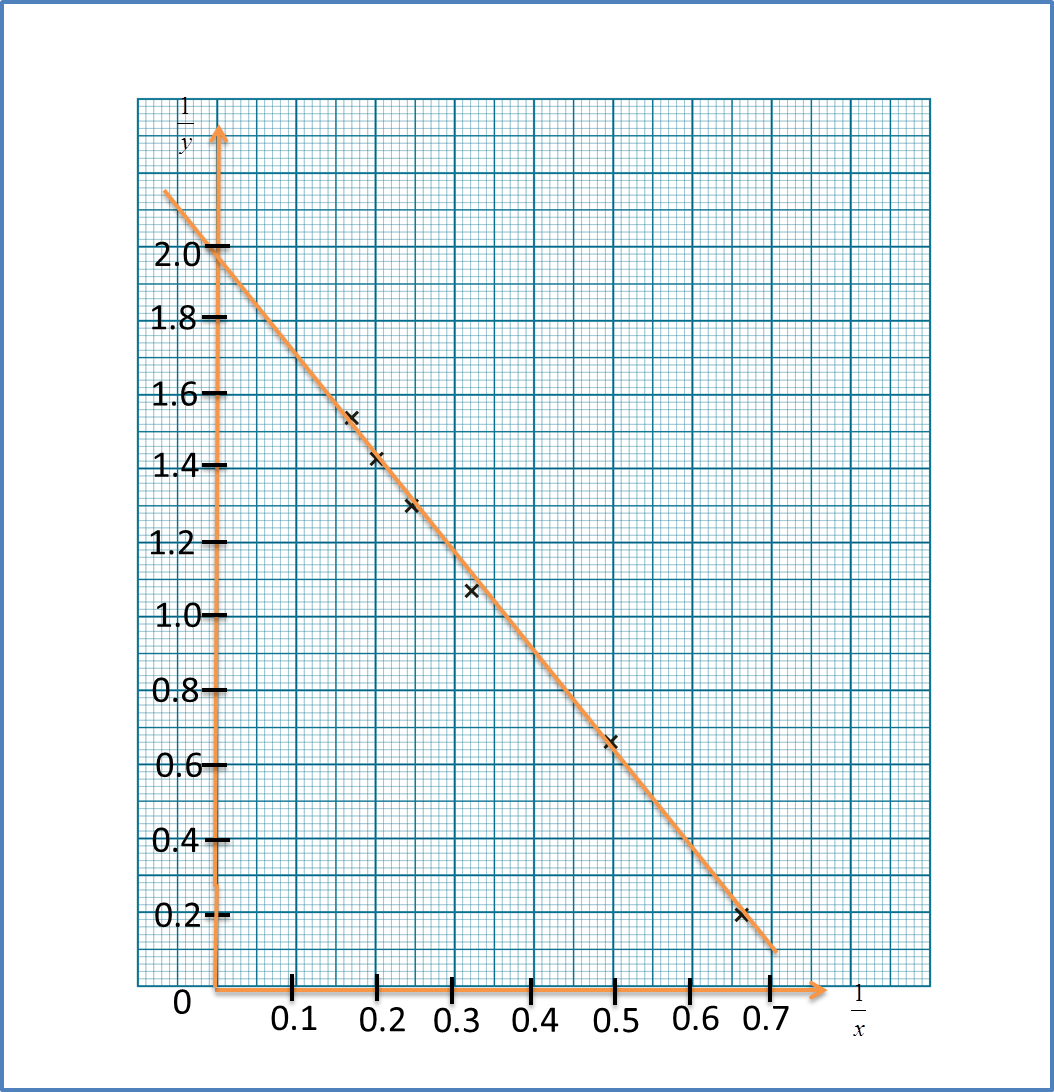
(a) Based on the table above, construct a table for the values of and . Plot against , using a scale of 2 cm to 0.1 unit on the – axis and 2 cm to 0.2 unit on the – axis. Hence, draw the line of best fit.
(b) Use the graph from (b) to find the value of
(i) a,
(ii) b.
Solution
Step 1 : Construct a table consisting X and Y.
Step 2 : Plot a graph of Y against X, using the scale given and draw a line of best fit
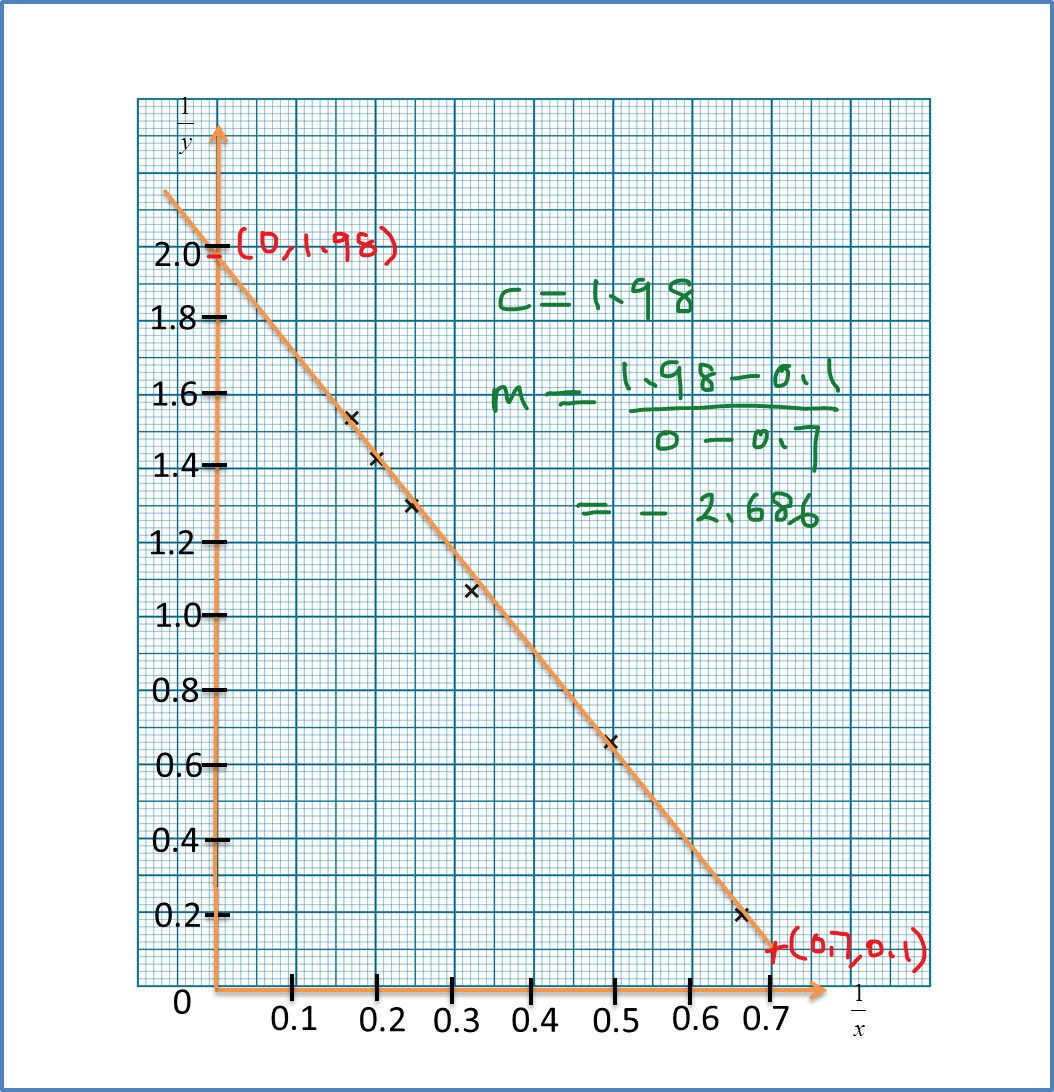
Step 3 : Calculate the gradient, m, and the Y-intercept, c, from the graph
Step 4 : Rewrite the original equation given and reduce it to linear form
Step 5 : Compare with the values of m and c obtained, find the values of the unknown required
Step 1 : Construct a table consisting X and Y.
Step 2 : Plot a graph of Y against X, using the scale given and draw a line of best fit
Step 3 : Calculate the gradient, m, and the Y-intercept, c, from the graph
Step 4 : Rewrite the original equation given and reduce it to linear form
Step 5 : Compare with the values of m and c obtained, find the values of the unknown required