Question 9:
Diagram 9 shows the normal distribution graph of the time taken, in minutes, for a group of students to answer a test with X ~ N(32, 36).
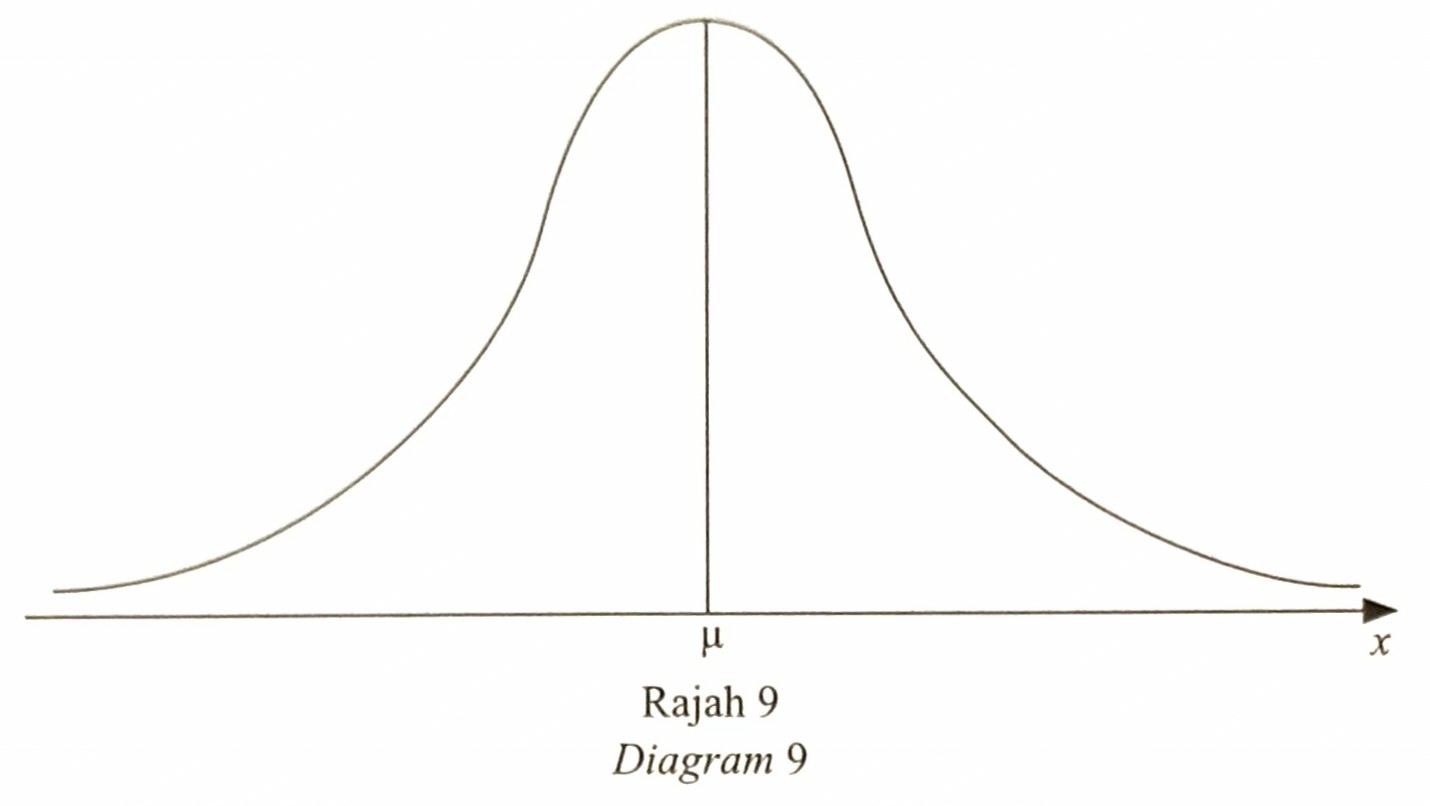
(i) A student is selected at random from the group. On the Diagram 9, shade the region that represents the probability of the student answering the test in at most 35 minutes.
Hence, find the probability.
(ii) Given that 12% of the students answered the test in less than t minutes, find the value of t.
[7 marks]
(b) A quiz consists of 6 multiple choice questions. Each question has equal marks and has 3 choices of answer such that only one of them is correct. The students need to score more than 70% to get a prize.
If a student randomly guesses all the answers, find the probability that the student does not get the prize.
[3 marks]
Answer:
(a)(i)
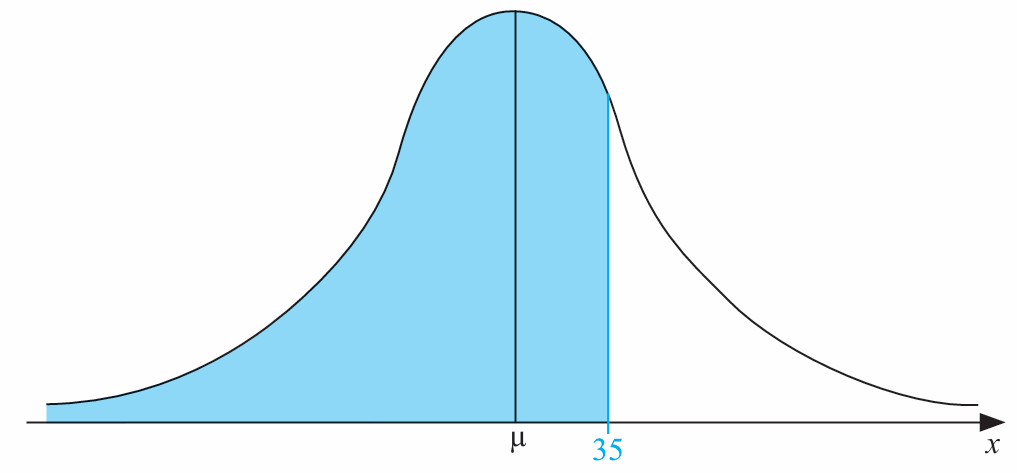
$$ \begin{aligned} & P(X \leqslant 35)=P\left(Z \leqslant \frac{35-32}{\sqrt{36}}\right) \\ & P(X \leqslant 35)=P(Z \leqslant 0.5) \\ & P(X \leqslant 35)=1-P(Z \geqslant 0.5) \\ & P(X \leqslant 35)=1-0.3085 \\ & P(X \leqslant 35)=0.6915 \end{aligned} $$
(a)(ii)
$$ \begin{aligned} P(X<t) & =0.12 \\ P\left(Z<\frac{t-32}{\sqrt{36}}\right) & =0.12 \end{aligned} $$
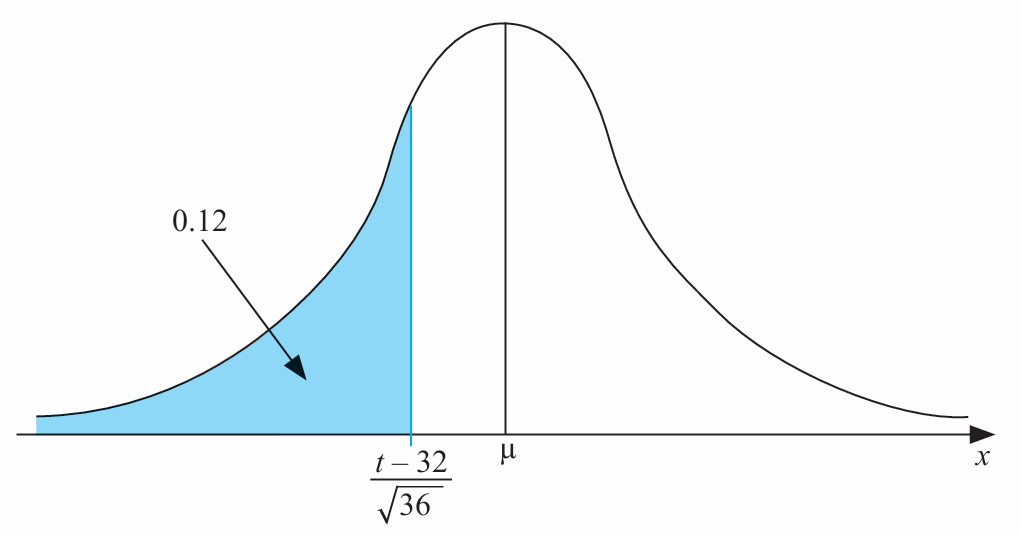
$$ \begin{aligned} \frac{t-32}{6} & =-1.175 \\ t-32 & =-7.05 \\ t & =24.95 \text { minutes } \end{aligned} $$
(b)
$$ \begin{aligned} & X \sim B\left(6, \frac{1}{3}\right) \\ & \begin{aligned} 70 \% & =\frac{70}{100} \times 6 \text { questions } \\ & =4.2 \text { questions } \end{aligned} \end{aligned} $$
To get the prize, the students need to answer at least 5 questions correct.
$$ \begin{aligned} P(\text { no prize }) & =1-P(X \geqslant 5) \\ & =1-P(X=5)-P(X=6) \\ & =1-{ }^6 C_5\left(\frac{1}{3}\right)^5\left(\frac{2}{3}\right)^1-{ }^6 C_6\left(\frac{1}{3}\right)^6\left(\frac{2}{3}\right)^0 \\ & =1-0.01783 \\ & =0.98217 \end{aligned} $$
Diagram 9 shows the normal distribution graph of the time taken, in minutes, for a group of students to answer a test with X ~ N(32, 36).
(i) A student is selected at random from the group. On the Diagram 9, shade the region that represents the probability of the student answering the test in at most 35 minutes.
Hence, find the probability.
(ii) Given that 12% of the students answered the test in less than t minutes, find the value of t.
[7 marks]
(b) A quiz consists of 6 multiple choice questions. Each question has equal marks and has 3 choices of answer such that only one of them is correct. The students need to score more than 70% to get a prize.
If a student randomly guesses all the answers, find the probability that the student does not get the prize.
[3 marks]
Answer:
(a)(i)
$$ \begin{aligned} & P(X \leqslant 35)=P\left(Z \leqslant \frac{35-32}{\sqrt{36}}\right) \\ & P(X \leqslant 35)=P(Z \leqslant 0.5) \\ & P(X \leqslant 35)=1-P(Z \geqslant 0.5) \\ & P(X \leqslant 35)=1-0.3085 \\ & P(X \leqslant 35)=0.6915 \end{aligned} $$
(a)(ii)
$$ \begin{aligned} P(X<t) & =0.12 \\ P\left(Z<\frac{t-32}{\sqrt{36}}\right) & =0.12 \end{aligned} $$
$$ \begin{aligned} \frac{t-32}{6} & =-1.175 \\ t-32 & =-7.05 \\ t & =24.95 \text { minutes } \end{aligned} $$
(b)
$$ \begin{aligned} & X \sim B\left(6, \frac{1}{3}\right) \\ & \begin{aligned} 70 \% & =\frac{70}{100} \times 6 \text { questions } \\ & =4.2 \text { questions } \end{aligned} \end{aligned} $$
To get the prize, the students need to answer at least 5 questions correct.
$$ \begin{aligned} P(\text { no prize }) & =1-P(X \geqslant 5) \\ & =1-P(X=5)-P(X=6) \\ & =1-{ }^6 C_5\left(\frac{1}{3}\right)^5\left(\frac{2}{3}\right)^1-{ }^6 C_6\left(\frac{1}{3}\right)^6\left(\frac{2}{3}\right)^0 \\ & =1-0.01783 \\ & =0.98217 \end{aligned} $$
Question 10:
Table 10.1 shows the values of two variables, x and y, obtained from an experiment. The variables x and y are related by the equation y = 2/a x3 + bx, such that a and b are constants.

(a) Based on Table 10.1, fill in the Table 10.2 on page 143 for the values of x2 and y/x. [2 marks]
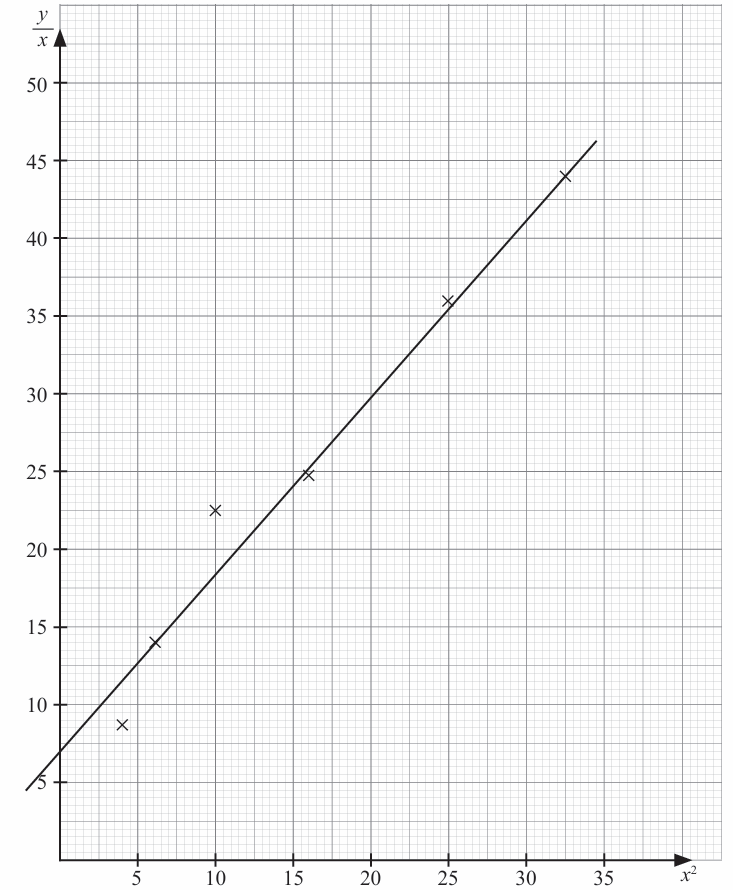
(b) Plot y/x against x2, using a scale of 2 cm to 5 units on both axes.
Hence, draw the line of best fit. [3 marks]
(c)(i) Reduce y = 2/a x3 + bx to linear form.
(ii) Hence, by using the graph in (b), find
(a) the value of a and of b,
(b) the correct value of y if one of the values of y has been wrongly recorded during the experiment.
[5 marks]
Answer:
(a)

(b)
(c)(i)
$$ \begin{aligned} & {\left[y=\frac{2}{a} x^3+b x\right] \div x} \\ & \frac{y}{x}=\frac{2}{a} x^2+b \\ & Y=m X+c \end{aligned} $$
(c)(ii)(a)
$$ \begin{aligned} &\begin{aligned} b & =c \\ & =7 \end{aligned}\\ &\begin{aligned} \frac{2}{a} & =m \\ \frac{2}{a} & =\frac{31-15}{21-7} \\ \frac{2}{a} & =\frac{8}{7} \\ 8 a & =14 \\ a & =\frac{7}{4} \end{aligned} \end{aligned} $$
(c)(ii)(b)
$$ \begin{aligned} \text { At } x^2 & =9.99 \\ x & =\sqrt{9.99} \\ x & =3.16 \end{aligned} $$
$$ \begin{aligned} \frac{y}{x} & =18.5 \\ \frac{y}{3.16} & =18.5 \\ y & =58.46 \end{aligned} $$
Table 10.1 shows the values of two variables, x and y, obtained from an experiment. The variables x and y are related by the equation y = 2/a x3 + bx, such that a and b are constants.
(a) Based on Table 10.1, fill in the Table 10.2 on page 143 for the values of x2 and y/x. [2 marks]
(b) Plot y/x against x2, using a scale of 2 cm to 5 units on both axes.
Hence, draw the line of best fit. [3 marks]
(c)(i) Reduce y = 2/a x3 + bx to linear form.
(ii) Hence, by using the graph in (b), find
(a) the value of a and of b,
(b) the correct value of y if one of the values of y has been wrongly recorded during the experiment.
[5 marks]
Answer:
(a)
(b)
(c)(i)
$$ \begin{aligned} & {\left[y=\frac{2}{a} x^3+b x\right] \div x} \\ & \frac{y}{x}=\frac{2}{a} x^2+b \\ & Y=m X+c \end{aligned} $$
(c)(ii)(a)
$$ \begin{aligned} &\begin{aligned} b & =c \\ & =7 \end{aligned}\\ &\begin{aligned} \frac{2}{a} & =m \\ \frac{2}{a} & =\frac{31-15}{21-7} \\ \frac{2}{a} & =\frac{8}{7} \\ 8 a & =14 \\ a & =\frac{7}{4} \end{aligned} \end{aligned} $$
(c)(ii)(b)
$$ \begin{aligned} \text { At } x^2 & =9.99 \\ x & =\sqrt{9.99} \\ x & =3.16 \end{aligned} $$
$$ \begin{aligned} \frac{y}{x} & =18.5 \\ \frac{y}{3.16} & =18.5 \\ y & =58.46 \end{aligned} $$