Question 1 (2 marks):
Diagram 1 shows a probability distribution graph for a random variable X, X ~ N(μ, σ2).
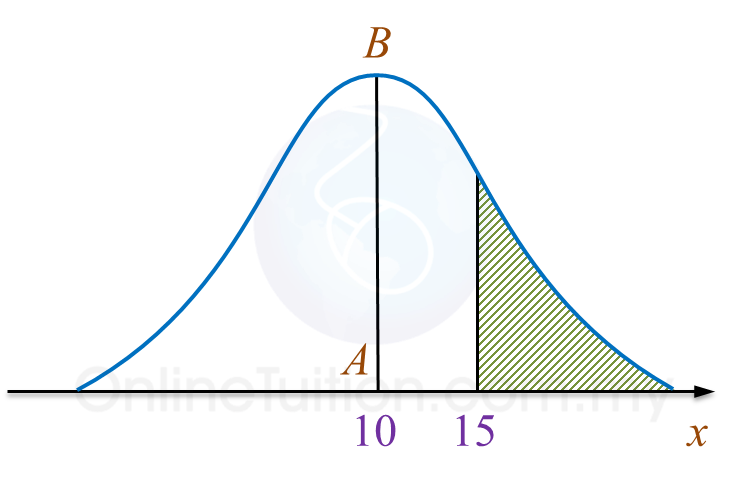 Diagram 1
It is given that AB is the axis of symmetry of the graph.
(a) State the value of μ.
(b) If the area of the shaded region is 0.38, state the value of P(5 ≤ X ≤ 15).
Solution:
(a)
μ = 0
(b)
P(10 ≤ X ≤ 15)
= 0.5 – 0.38
= 0.12
P(5 ≤ X ≤ 10)
= P(10 ≤ X ≤ 15)
= 0.12
Thus P(5 ≤ X ≤ 15)
= 0.12 + 0.12
= 0.24
Diagram 1 shows a probability distribution graph for a random variable X, X ~ N(μ, σ2).
Diagram 1It is given that AB is the axis of symmetry of the graph.
(a) State the value of μ.
(b) If the area of the shaded region is 0.38, state the value of P(5 ≤ X ≤ 15).
Solution:
(a)
μ = 0
(b)
P(10 ≤ X ≤ 15)
= 0.5 – 0.38
= 0.12
P(5 ≤ X ≤ 10)
= P(10 ≤ X ≤ 15)
= 0.12
Thus P(5 ≤ X ≤ 15)
= 0.12 + 0.12
= 0.24
Question 2 (2 marks):
Solution:
(a)
n = 1, 2, 3, 4, 5
(b)
y = m + n
Solution:
(a)
n = 1, 2, 3, 4, 5
(b)
y = m + n
Question 3 (2 marks):
Table 1 shows the information about a set of data.
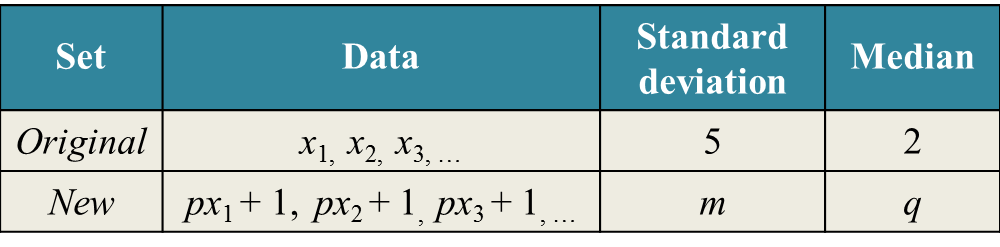 Table 1
State
(a) the value of p if m = 20,
(b) the value of q if p = 2.5.
Solution:
(a)
New standard deviation = original standard deviation × p
20 = 5 × p
p = 4
(b)
New median = [original median × p] + 1
q = 2p × 1
q = 2(2.5) + 1
q = 5 + 1
q = 6
Table 1 shows the information about a set of data.
Table 1State
(a) the value of p if m = 20,
(b) the value of q if p = 2.5.
Solution:
(a)
New standard deviation = original standard deviation × p
20 = 5 × p
p = 4
(b)
New median = [original median × p] + 1
q = 2p × 1
q = 2(2.5) + 1
q = 5 + 1
q = 6
Question 4 (3 marks):
Table 2 shows the distribution of scores obtained by a group of students in a competition.
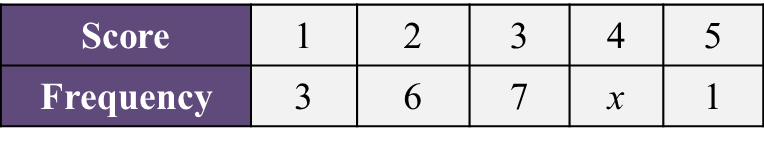 Table 2
(a) State the minimum value of x if the mode score is 4.
(b) Find the mean score of the distribution if x = 1.
Solution:
(a)
Minimum value of x = 8
(b)
Table 2 shows the distribution of scores obtained by a group of students in a competition.
Table 2(a) State the minimum value of x if the mode score is 4.
(b) Find the mean score of the distribution if x = 1.
Solution:
(a)
Minimum value of x = 8
(b)