(B) Domain, Range, Objects and Images of a Function
Example:
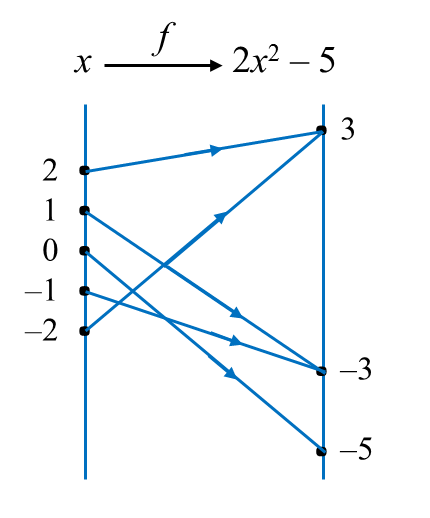
The arrow diagram above represents the function f : x → 2x2 – 5. State
(a) the domain,
(b) the range,
(c) the image of –2,
(d) the objects of
(i) –3,
(ii) –5.
Solution:
(a) Domain = {–2, –1, 0, 1, 2}.
(b) Range = {–5, –3, 3}.
(c) The image of –2 is 3.
(d) (i) The objects of –3 are 1 and –1.
(d) (ii) The objects of –5 is 0.
Example:
The arrow diagram above represents the function f : x → 2x2 – 5. State
(a) the domain,
(b) the range,
(c) the image of –2,
(d) the objects of
(i) –3,
(ii) –5.
Solution:
(a) Domain = {–2, –1, 0, 1, 2}.
(b) Range = {–5, –3, 3}.
(c) The image of –2 is 3.
(d) (i) The objects of –3 are 1 and –1.
(d) (ii) The objects of –5 is 0.
(C) Absolute Value Functions
1. Symbol | | is read as ‘the modulus’ of a number. In general, the modulus of x, that is | x |, is defined as
2. In other words, modulus of a number always positive.
3. The absolute value function | f(x) | is defined by
Solution:
(a)
Given f (x) = |x + 2|
Image of –4 is f(–4) = | –4 + 2| = | –2| = 2
Image of –3 is f(–3) = | –3 + 2| = | –1| = 1
Image of 0 is f(0) = | 0 + 2| = | 2 | = 2
Image of 2 is f(2) = | 2 + 2| = | 4 | = 4
(b)
From (a),
f(–4) = 2
f(–3) = 1
f(0) = 2
f(2) = 4
Determine the point where the graph touches the x-axis.
At x-axis, f (x) = 0
|x + 2| = 0
x + 2 = 0
x = –2
Therefore, range of values of f (x) is 0 ≤ f (x) ≤ 4.
1. Symbol | | is read as ‘the modulus’ of a number. In general, the modulus of x, that is | x |, is defined as
2. In other words, modulus of a number always positive.
3. The absolute value function | f(x) | is defined by
Example:
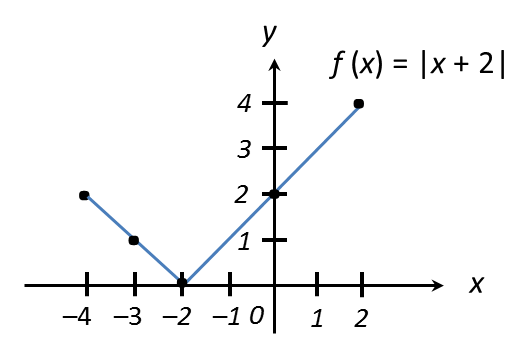
Given function f : x → |x + 2|.
(a) Find the image of –4, –3, 0 and 2.
(b) Sketch the graph of f (x) for the domain –4 ≤ x ≤ 2.
Hence, state the range of values of f (x) based on the given domain.
Solution:
(a)
Given f (x) = |x + 2|
Image of –4 is f(–4) = | –4 + 2| = | –2| = 2
Image of –3 is f(–3) = | –3 + 2| = | –1| = 1
Image of 0 is f(0) = | 0 + 2| = | 2 | = 2
Image of 2 is f(2) = | 2 + 2| = | 4 | = 4
(b)
From (a),
f(–4) = 2
f(–3) = 1
f(0) = 2
f(2) = 4
Determine the point where the graph touches the x-axis.
At x-axis, f (x) = 0
|x + 2| = 0
x + 2 = 0
x = –2
Therefore, range of values of f (x) is 0 ≤ f (x) ≤ 4.