Measures of Dispersion (Part 2)
7.2b Interquartile Range 2
7.2b Interquartile Range 2
(C) Interquartile Range of Grouped Data (with Class Interval)
The interquartile range of grouped data can be determined by Method 1 (using a cumulative frequency table) or Method 2 (using an ogive).
Example:
The table below shows the marks obtained by a group of Form 4 students in school mathematics test.
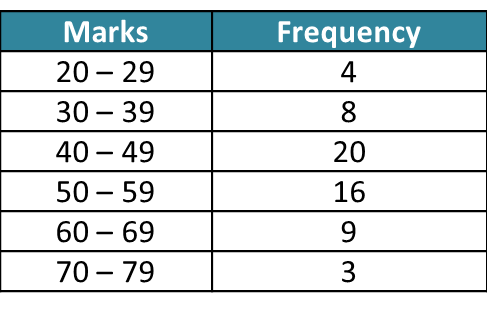
Estimate the interquartile range.
Step 3:
Step 4:
The table below shows the marks obtained by a group of Form 4 students in school mathematics test.
Estimate the interquartile range.
Solution:
Upper quartile, Q3 = the observation
= the 45thobservation
Step 2:
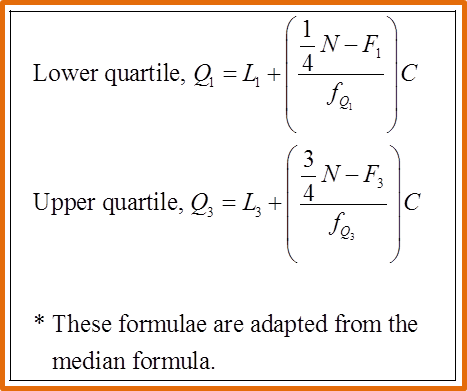
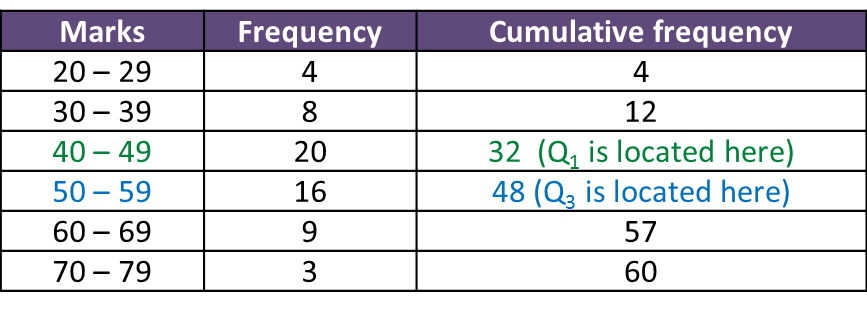
Method 1: From Cumulative Frequency Table
Step 1:
Lower quartile, Q1 = the
observation
= the 15thobservation
Upper quartile, Q3 = the observation
= the 45thobservation
Step 2:
Step 3:
Step 4:
Interquartile Range
= upper quartile – lower quartile
= Q3– Q1
= 57.625 – 41
= 16.625