Question 5:


Solution:
(a)

(b)
The table shows the cumulative frequency distribution for the distance travelled by 80 children in a competition.

(a) Based on the table above, copy and complete the table below.

(b) Without drawing an ogive, estimate the interquartile range of this data.
Solution:
(a)

Interquartile range = Third Quartile – First Quartile
Third Quartile class, Q3 = ¾ × 80 = 60
Therefore third quartile class is the class 60 – 69.
First Quartile class, Q1= ¼ × 80 = 20
Therefore first quartile class is the class 30 – 39.
Question 6:
Solution:

Substitute (1) into (2):
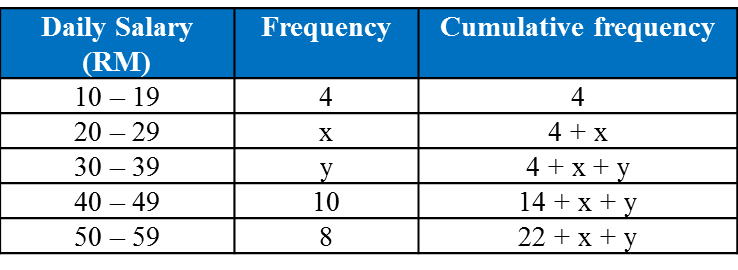
Table shows the daily salary obtained by 40 workers in a construction site.


Given that the median daily salary is RM35.5, find the value of x and of y.
Hence, state the modal class.

Total workers = 40
22 + x + y = 40
x = 18 – y ——(1)
Median daily salary = 35.5
Median class is 30 – 39
Substitute (1) into (2):
3y = 80 – 5(18 – y)
3y = 80 – 90 + 5y
–2y = –10
y = 5
Substitute y = 5 into (1)
x = 18 – 5 = 13
Thus x = 13 and y = 5.
The modal class is 20 – 29 daily salary (RM).
what class lesson is this?